
PHP 性能追踪及分析工具(XHPROF)
什么是 XHPROF?
XHPROF:Facebook 开源的轻量级PHP性能分析工具。
它报告函数级别的请求次数和各种指标,包括阻塞时间,CPU时间和内存使用情况。
XHProf 分析报告有助于理解被执行的代码的结构。
它有一个简单的HTML的用户界面( PHP写成的)。
基于浏览器的性能分析用户界面能更容易查看,或是与同行们分享成果。
也能绘制调用关系图。
XHPROF 与 Xdebug 区别
Xdebug 是一个开放源代码的PHP程序调试器(即一个Debug工具)。
对于本地开发环境来说,进行性能分析 Xdebug 是够用了。
但如果是线上环境的话,Xdebug 消耗较大,配置也不够灵活。
如何安装 XHPROF ?
//源码安装
cd /usr/local/src
wget http://pecl.php.net/get/xhprof-2.3.10.tgz
tar zxvf xhprof-2.3.10
cd xhprof-2.3.10/extension/
/usr/local/php/bin/phpize
./configure --with-php-config=/usr/local/php/bin/php-config
make
make install
在 php.ini 末尾新增
[xhprof]
extension = xhprof.so
xhprof.output_dir = 自定义文件夹(/tmp/xhprof_log)

// /tmp/xhprof_log 必须存在且有写入权限
重启环境
代码中查看 phpinfo 是否包含 xhprof。
一切顺利的话,那么 xhprof 安装成功。
宝塔等面板
选择php版本 拓展 xhprof 宝塔直接选择安装修改ini即可~
如何配置 XHPROF?
//比如项目地址:local.test_xhprof.com
//在项目入口文件中新增一下代码(CI框架为例)
xhprof_enable(XHPROF_FLAGS_NO_BUILTINS +
              XHPROF_FLAGS_CPU +
              XHPROF_FLAGS_MEMORY);

register_shutdown_function(function(){
	$data = xhprof_disable();   //返回运行数据
	//xhprof_lib 在下载的包里存在这个目录,记得将目录包含到运行的php代码中
	include '/home/www/mi/xhprof/xhprof_lib/utils/xhprof_lib.php';
	include '/home/www/mi/xhprof/xhprof_lib/utils/xhprof_runs.php';
	$objXhprofRun = new XHProfRuns_Default();
	$objXhprofRun->save_run($data, "test"); //test 表示文件后缀
});

//一切顺利的话,那么代码安装成功。

//访问:local.test_xhprof.com,应该在 /tmp/xhprof_log 存在日志文件。
thinkphp等
index.php
// [ 应用入口文件 ]
namespace think;

use app\common\Profiler;

....


// 启用 XHProf 分析
Profiler::startProfiling();

// 执行HTTP应用并响应
$http = (new App())->http;

$response = $http->run();
$response->send();
$http->end($response);
// 关闭 XHProf 分析
Profiler::stopProfiling();

//类
Profiler.php

<?php

namespace app\common;

class Profiler
{
    public static function startProfiling()
    {
        if (extension_loaded('xhprof')) {
            xhprof_enable(XHPROF_FLAGS_CPU | XHPROF_FLAGS_MEMORY);
        }
    }

    public static function stopProfiling()
    {
        if (extension_loaded('xhprof')) {
            $xhprofData = xhprof_disable();
            $xhprofRoot = '/www/wwwroot/xhprof/';  // XHProf安装的目录

            include_once $xhprofRoot . "xhprof_lib/utils/xhprof_lib.php";
            include_once $xhprofRoot . "xhprof_lib/utils/xhprof_runs.php";

            $xhprofRuns = new \XHprofRuns_Default();
            $runId = $xhprofRuns->save_run($xhprofData, "thinkphp");

            // 输出 Run ID
            echo "XHProf Run ID: $runId";
        }
    }
}
如何 UI 展示?
//将 xhprof_html、xhprof_lib 拷贝到虚拟目录中
cd /usr/local/src
cp xhprof-2.3.10/xhprof_html /home/www/mi/xhprof/xhprof_html
cp xhprof-2.3.10/xhprof_lib /home/www/mi/xhprof/xhprof_lib
配置虚拟主机(local.xhprof.com)
local.xhprof.com 指向 /home/www/mi/xhprof/ 即可。
访问:local.xhprof.com/xhprof_html 会显示日志文件。
如下图:
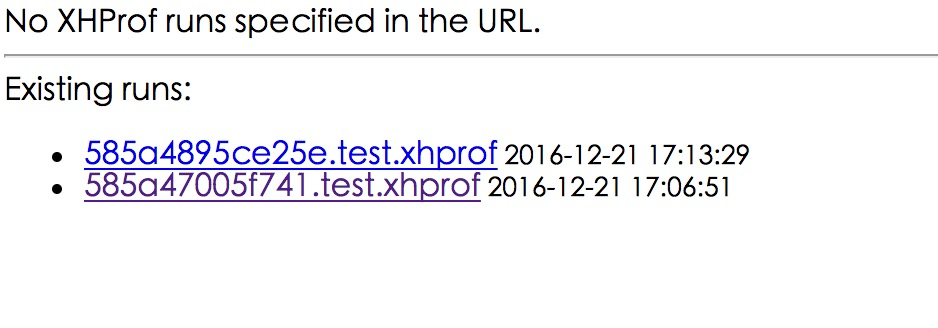
点击日志文件显示下图。
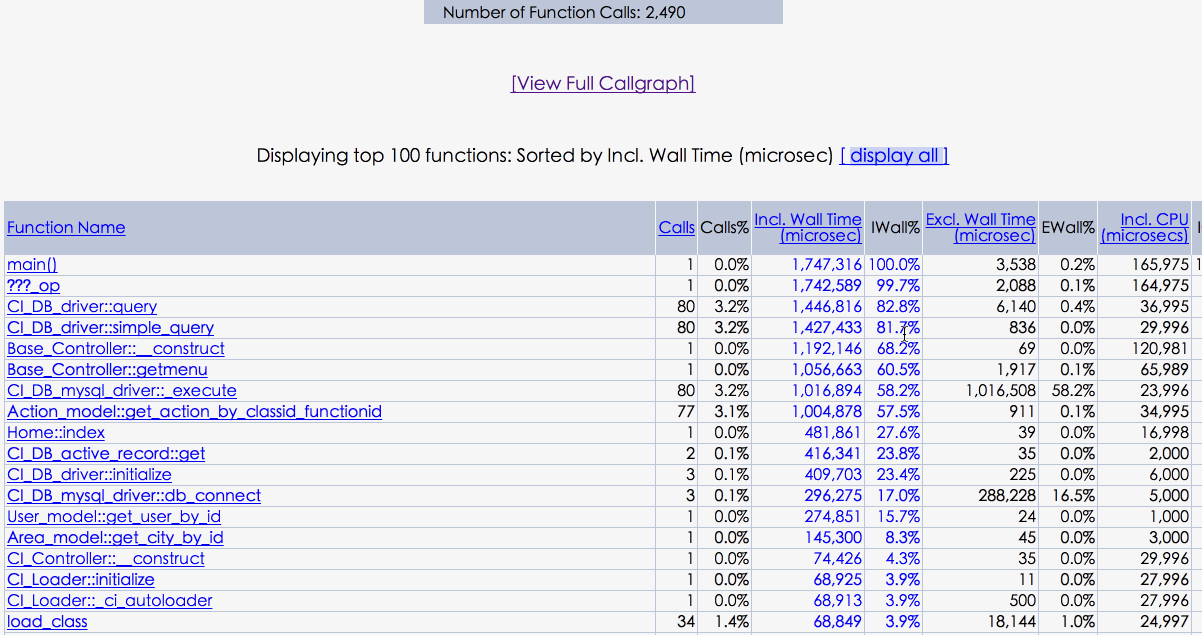
点击 [View Full Callgraph] 会显示调用关系图。
在生成图的时候需要服务器装一个插件:graphviz。
cd /usr/local/src
wget http://www.graphviz.org/pub/graphviz/stable/SOURCES/graphviz-2.24.0.tar.gz
tar zxvf graphviz-2.24.0.tar.gz
cd graphviz-2.24.0
./configure
make
make install
一切顺利的话,那么 graphviz 安装成功。
如果点击 [View Full Callgraph] 依旧无法打开。
报错:failed to execute cmd " dot -Tpng"
表示:php.ini 中一些执行函数禁用了。
在 php.ini 中 去掉 disable_functions 中的如下函数
system
shell_exec
proc_open
proc_get_status
PHP 重启一下。
一切顺利的话,应该不会报错了,就可以看到高大上的效果图啦。
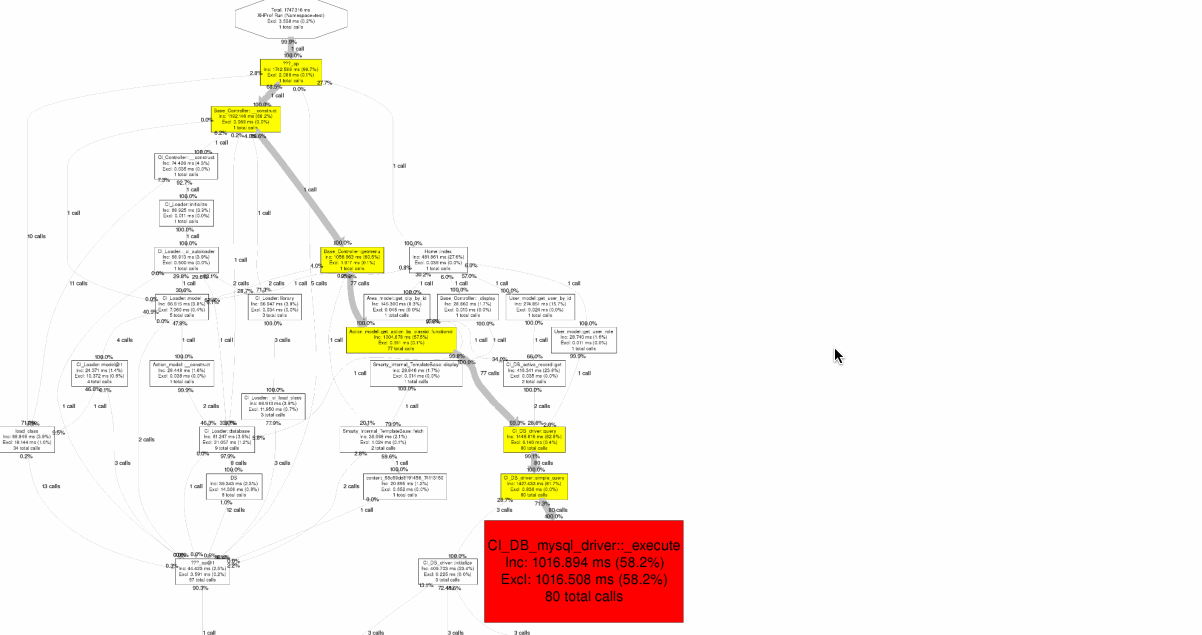
点击局部,可以看到大图。
以上,大家可以看到 函数级别的请求次数和各种指标,包括阻塞时间,CPU时间和内存使用情况。
如何更好的UI展示?
可能大家有一些疑问:
- 是否能有更好的UI展示?
- 当服务器上有多个站点的时候,是否配置一次即可?
接下来给大家介绍:xhprof gui
xhprof gui : 一个xhprof的一个ui展现。
使 xhprof 界面更漂亮,功能更强大。
- 友好的界面
- 数据库存储(mysql)
- 支持按请求百分比执行 xhprof 优化。
- 降低服务器负载。
如何配置 xhprof gui
下载后存放到:xhprof_gui 文件中。
配置虚拟主机(local.xhprofgui.com)
local.xhprofgui.com 指向 /home/www/mi/xhprof_gui/ 即可。
第一步,需要将 xhprof_gui/xhprof_lib/config.sample.php 重命名 为 config.php。
第二步,根据 config.php 中数据库变量(dbuser、dbpass、dbname),配置一个数据库。
第三步,将 config.php 中 doprofile 设置为 true。
第三步,创建一张表。
//源代码:xhprof_lib/utils/xhprof_runs.php
CREATE TABLE `details` (
  `id` char(17) NOT NULL,
  `url` varchar(255) default NULL,
  `c_url` varchar(255) default NULL,
  `timestamp` timestamp NOT NULL default CURRENT_TIMESTAMP on update CURRENT_TIMESTAMP,
  `server name` varchar(64) default NULL,
  `perfdata` MEDIUMBLOB,
  `type` tinyint(4) default NULL,
  `cookie` BLOB,
  `post` BLOB,
  `get` BLOB,
  `pmu` int(11) unsigned default NULL,
  `wt` int(11) unsigned default NULL,
  `cpu` int(11) unsigned default NULL,
  `server_id` char(3) NOT NULL default 't11',
  `aggregateCalls_include` varchar(255) DEFAULT NULL,
  PRIMARY KEY  (`id`),
  KEY `url` (`url`),
  KEY `c_url` (`c_url`),
  KEY `cpu` (`cpu`),
  KEY `wt` (`wt`),
  KEY `pmu` (`pmu`),
  KEY `timestamp` (`timestamp`)
) ENGINE=MyISAM DEFAULT CHARSET=utf8;
如果是 Nginx 服务器 新增配置:
fastcgi_param PHP_VALUE "auto_prepend_file=/home/www/mi/xhprof_gui/external/header.php";如果是 Apache 服务器:
php_admin_value auto_prepend_file "/home/www/mi/xhprof_gui/external/header.php"配置到这里,可以运行下。
简单说明下:
如果你配置在公共的配置文件中,那么表示站点上所有的域名访问都会进行日志记录。
如果你配置在单个域名的配置文件中,表示只有访问当前域名的时候回进入日志记录。
例如单个域名为:local.xh.test.com
如果报错,可以调试下 header.php。
以上配置,存储使用的是Mysql。
存储也可以使用MongoDB,大家可以研究下 ~
如果看到效果?
访问 local.xh.test.com,记录日志。
访问 local.xhprofgui.com,查看效果。
效果图,如下:
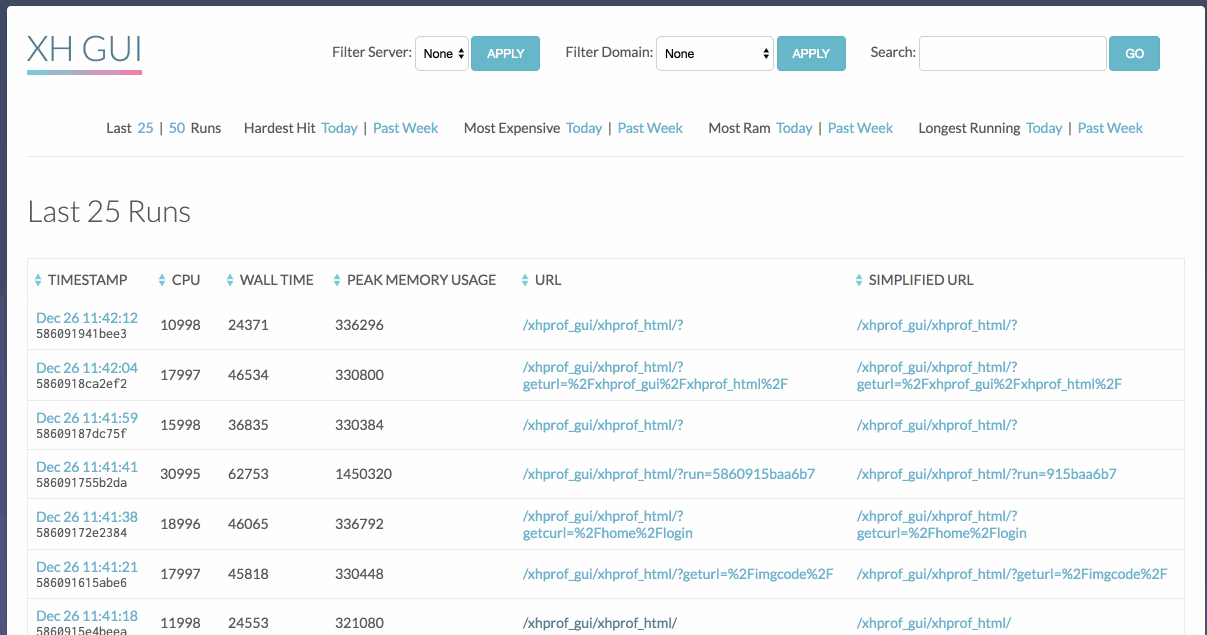
我本地为 nginx 环境,已经配置成功。
原文转载自作者:程序员新亮
链接:https://juejin.cn/post/6844903458286338062
版权声明:
作者:超级管理员
链接:
https://apecloud.ltd/article/detail.html?id=XHPROF
来源:猿码云个人技术站
文章版权归作者所有,未经允许请勿转载。


共有0条评论